Stars influence the central distribution of dark matter in galaxy clusters
Dark matter is at the centre of our understanding of the physics of the early Universe, of cosmic large-scale structure and of galaxy formation. In its simplest form, "cold dark matter" consists of non-relativistic weakly interacting particles of a kind not included in the standard model of particle physics. On astrophysical scales the dark matter only interacts with baryons (ordinary matter) through the force of gravity. Because of the simple physics this entails, its dynamics and clustering can be followed through N-body simulations. Recently, scientists at the MPA have performed cosmological N-body simulations showing that the mergers of galaxies (containing both stars and dark matter) at the centre of galaxy clusters can alter the central distribution of dark matter in a way that alleviates recent discrepancies found between observations and simulations.
, its member galaxies and its central Brightest Cluster Galaxy which exhibits an extended diffuse envelope of stars around it.")
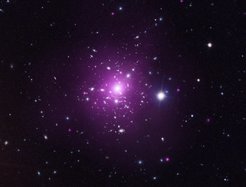
Figure 1: A composite optical and X-ray image of Abell 383, one of the 7 relaxed rich clusters considered in the study by Newman et al. 2013a,b. This image shows the X-ray emission of the hot electron gas in the cluster (in purple), its member galaxies and its central Brightest Cluster Galaxy which exhibits an extended diffuse envelope of stars around it.
 act as additional lenses which further distort some of the multiple images.")
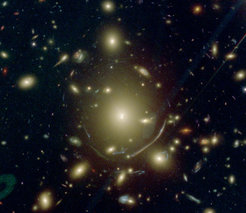
Figure 2: A zoom on the BCG in Abell 383 taken with the Hubble Space Telescope. The central BCG is surrounded by an extended envelope of stars and the numerous distorted images around it are background galaxies which are getting lensed by the cluster. Because of their high masses, galaxy clusters can act as gravitational lenses: the background galaxies close to the line of sight of the cluster get multiply imaged or distorted into large arcs like the one visible south of the BCG. Some of the cluster galaxies (e.g. the bright elliptical galaxy one on the south-east of the BCG) act as additional lenses which further distort some of the multiple images.
, dark matter and stellar mass. The magenta line corresponds to the distribution of matter in a dark-matter-only run of the cluster (where the contribution of stars in galaxies was completely neglected). The total mass profile as a whole is very similar to the dark-matter-only run except where the density of stars overtakes that of the dark matter. The final dark matter profile on the other hand is shallower than the original dark-matter-only run already at the half-light radius of the BCG marked by the red arrow. The black arrow shows the radius where effects from black hole mergers would significantly affect the distribution of stars and dark matter in the BCG core. Right Panel: Density profile for one of the clusters in the Newman et al. (2013) sample, Abell 611. Black, red and blue lines represent the contributions from total, stellar and dark matter respectively. The dashed lines mark the 1-sigma error on the modelling. The mass distribution in this cluster is quite similar to one of the simulated clusters in the left panel.")
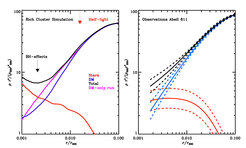
Figure 3: Density profiles of simulated and real clusters. Left Panel: Density profile for one of the re-simulated galaxy cluster. The black, red and blue lines represent the distribution of total (stars+dark matter), dark matter and stellar mass. The magenta line corresponds to the distribution of matter in a dark-matter-only run of the cluster (where the contribution of stars in galaxies was completely neglected). The total mass profile as a whole is very similar to the dark-matter-only run except where the density of stars overtakes that of the dark matter. The final dark matter profile on the other hand is shallower than the original dark-matter-only run already at the half-light radius of the BCG marked by the red arrow. The black arrow shows the radius where effects from black hole mergers would significantly affect the distribution of stars and dark matter in the BCG core. Right Panel: Density profile for one of the clusters in the Newman et al. (2013) sample, Abell 611. Black, red and blue lines represent the contributions from total, stellar and dark matter respectively. The dashed lines mark the 1-sigma error on the modelling. The mass distribution in this cluster is quite similar to one of the simulated clusters in the left panel.


