How do star clusters form in dwarf galaxies?
In the interstellar medium (ISM) of galaxies, stars form in small groups groups of a few hundred and clusters up to several million stars. A full theoretical model of this process and its impact on galaxy evolution is still in its infancy. MPA researches and their collaborators have developed a highly complex numerical model to simulate the multi-phase ISM and how star clusters emerge in dwarf galaxies. The supercomputer simulations show that the properties of the star clusters depend on how efficiently stars can form from the cold dense gas. Detailed post-processing then allowed the researchers to compare their results to observations. This demonstrates the scientific fidelity of the new model, its current limitations, and observational limitations on how well clusters can be detected in regions of high star formation activity. The studies are a major step towards a comprehensive model for star cluster formation.
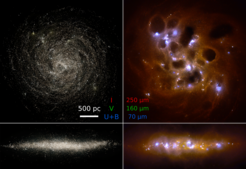
 and edge-on (bottom) projections. The left images show the galaxy in visual bands (I=red, V=green, U+B=blue), the right images at infrared wavelenths. The visual bands show direct, scattered and attenuated stellar light, while the infrared bands show stellar emission that is absorbed and re-emitted by dust in the ISM. The blue regions are illuminated by young star clusters that can be seen as concentrations of visual light in the left images.")
Observations show that star formation is clustered, that is, stars form primarily in groups within collapsing cold gas clouds. Studying this with regular galaxy simulations is not possible as their resolution is too low and the stellar population is approximated by artificial ‘star particles’ representing several thousands of stars at a time. To understand how star clusters form and to probe their intrinsic small-scale features, one needs much higher resolution and numerical tools that capture the important astrophysical processes. This is the aim of the GRIFFIN project (see also the monthly highlight from October 2019).
The team has implemented numerical models for intricate heating and cooling processes as well as non-equilibrium chemistry of the ISM in galaxy formation simulations. With their photo-ionizing radiation, as well as supernova (SN) explosions newly formed massive stars can shape their surrounding interstellar medium. These models are essential for the accurate modeling of galactic star cluster formation at sub-parsec resolution. The team has carried out a suite of realistic isolated dwarf galaxy and galaxy merger simulations (see Fig. 1 for an example). These were run on supercomputers at MPCDF and SuperMUC at the Leibniz Supercomputing Center (LRZ) and are the basis for the studies.
Simulated starburst galaxy
bands with the resolution of HST. A lot of bound star clusters form during the starburst. The first massive clusters blow out a supernova superbubble that can be seen in the central region of the system. Several clusters – especially in the most intense star forming regions – are obscured by dusty gas in some of the projections.
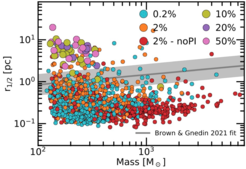
The effect of star formation efficiency on star cluster properties
, the clusters have smaller radii, showing that these clusters are compact and tightly bound. Simulations with higher star formation efficiencies (larger green, purple and pink circles) produce fewer clusters with larger radii for the same mass, meaning that the clusters are more extended, and therefore more likely to be disrupted. The line is a fit of observed cluster properties.")
A recent study led by Jessica May Hislop at MPA aims at understanding which physical processes regulate the formation and structural properties, such as masses and sizes, of star clusters in dwarf galaxies. The formation processes of individual stars, i.e. the collapse of gas to real stellar densities, can not be resolved even in such high resolution simulations. However, a model parameter termed star formation efficiency – the fraction of gas in a collapsing cloud converted into stars on the cloud collapse timescale – can be used to capture those smaller scale processes. It controls the typical average ISM density at which the stars form and start dispersing their ambient collapsing birth cloud by radiation and SN explosions. This process is termed ‘stellar feedback’.
All models for isolated dwarf galaxies form their stars at a similar rate and the cluster mass functions have slopes which are in agreement with observations. The fraction of stars forming in clusters and the cluster properties, however, can differ significantly. In models with low efficiency (e.g. 0.2%) gas clouds can collapse into small regions with high densities before they form stars. It becomes very difficult for stellar feedback processes to destroy the clouds and prevent further star formation. Cloud disruption is much easier for models with high star formation efficiency (e.g. 50%), where stars form at an earlier phase of collapse. This results in less clusters, which are more extended and have lower typical masses. Still, none of the models presented here perfectly reproduces the observed cluster properties (see also Fig. 2). This provides motivation for developing more accurate numerical models for star cluster formation in supercomputer simulations.
Panchromatic observations of simulated star clusters
 of the simulated dwarf starburst (line) agrees well with observations both of direct starlight and radiation that has been scattered, absorbed and re-emitted by dust. The observed dwarf galaxies NGC 1569 (red circles) and II Zw 40 (blue triangles) are undergoing similar bursts of recent star formation (data from NASA/IPAC Extragalactic Database).")
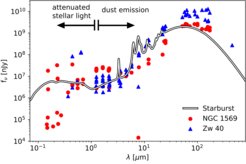
Mismatches between the simulated and observed star cluster properties may, however, not only be caused by the simulation models alone. The sensitivity, resolution, spectral coverage and noise in observational data can degrade or bias the underlying physical properties. A study led by Natalia Lahén at MPA investigates the effect of observational limitations on determining the mass distribution of forming star clusters. Physical crowding of sources makes it challenging for observers to separate individual star clusters in regions of high star formation activity, especially at distances beyond the Local Group. Using the same model as described above, the researchers generated an observational view of a dwarf starburst galaxy. For this, the simulated system was post-processed with the radiative transfer code SKIRT from UV wavelengths to infrared emission from dust. The good agreement of the spectral energy distribution with observed dwarf galaxy starbursts supports the scientific fidelity of the simulation model (see Fig 3).
 and 50 Mpc (bottom). The zoomed-in regions (middle) show the apertures (red circles) placed on the detected clusters. The lower spatial resolution for more distant galaxies (1.5 pc per pixel in the closer galaxy compared to 7.5 pc per pixel in the more distant galaxy) result in an apparent flattening of the cluster mass function and artificially massive super star clusters (right panel). The simulated mass function of bound clusters (grey points) can be used to quantify this effect.The white circle shows the location of the most massive cluster detected in the low-resolution image (bottom middle). It is repeated in the higher resolution image (top middle) and highlights how the region contains a multitude of smaller mass clusters that are blended together at poor resolution.")
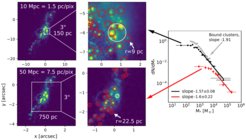
The white circle shows the location of the most massive cluster detected in the low-resolution image (bottom middle). It is repeated in the higher resolution image (top middle) and highlights how the region contains a multitude of smaller mass clusters that are blended together at poor resolution.
Many star cluster studies, in particular with the Hubble Space Telescope (HST), rely on photometric studies at visual wavelengths (e.g. the V-band). Here individual star clusters are detected and their properties like mass, size, and age are derived within circular regions (apertures) using automated algorithms. At high star formation activity, the forming clusters might form so close to each other that they cannot be accurately separated; this is called crowding. At larger distances, this problem becomes worse, where even more individual clusters appear as merged and are observed as if they were more massive and larger clusters. Fig. 4 shows a V-band image of the simulated galaxy as it would look through the eyes of HST if placed at two different distances. The results of these mock observations indicate that the masses of real, observed young star clusters with masses of a few million solar masses might be overestimated by up to a factor of 2.5 and their observed mass functions could be shallower than the true underlying cluster mass functions .
The two studies demonstrate how modern high-performance simulations can be used to identify and scientifically validate important astrophysical processes that regulate the formation of star clusters. They also highlight the importance of accurate comparison with observations in assessing the power of the underlying theoretical models. This joint approach will pave the way towards a modern comprehensive model for star cluster formation.


