| Gadget-2(§) (dm only run) | |||||
| Run | Tcpu [h] | Nproc | Ntstep | Mdm [Msol/h] | Rsoft [kpc/h] |
| 64ł | 1.2 | 4 | 1153 | 28.6e10 | 31.0 |
| 128ł | 19.1 | 8 | 1985 | 3.57e10 | 15.5 |
| 256ł | 258.1 | 16 | 3035 | 0.45e10 | 7.75 |
| 512ł | 6544.49 | 64 | 4943 | 5.6e8 | 3.775 |
| Gadget-2(§) | |||||
| Run | Tcpu [h] | Nproc | Ntstep | Mdm/Mgas [Msol/h] | Rsoft [kpc/h] |
| 64ł | 5.2 | 4 | 3316 | 24.0e10 / 4.55e10 | 31.0 |
| 128ł | 144.4 | 8 | 9646 | 3.0e10 / 0.57e10 | 15.75 |
| 256ł | 1893.53 | 16 | 25896 | 3.76e9 / 7.11e8 | 7.875 |
| Gadget-2(§) (box like runs) | |||||
| Run | Tcpu [h] | Nproc | Ntstep | Mdm/Mgas [Msol/h] | Rsoft [kpc/h] |
| 64ł | 4.9 | 4 | 2321 | 24.0e10 / 4.55e10 | 31.0 |
| 128ł | 109.8 | 8 | 6346 | 3.0e10 / 0.57e10 | 15.75 |
| 256ł | 1484.57 | 32 | 17205 | 3.76e9 / 7.11e8 | 7.875 |
| ENZO(+) | |||||
| Run | Tcpu [h] | Nproc | Ntstep | Mdm [Msol/h] | Grid [kpc/h] |
| 64ł | 0.52 | 16 | 241 | 1562.5 | |
| 128ł | 7.7 | 16 | 304 | 781.25 | |
| TVD(*) | |||||
| Run | Tcpu [h] | Nproc | Ntstep | Mdm [Msol/h] | Grid [kpc/h] |
| (512-256)ł | ~200 | 2 | 468 | 195.312 | |
| Gadget-2 | Gadget-2 (grid like IC) | TVD |
|
|
|
| 64ł: | 128ł: | 256ł: | 256ł (zoom): |
|
|
|
|
| Validating the ICs (using Gadget) | |||
| Gadget-2 (dm only run) | Gadget-2 (SPH run, mass is the total = dark matter + baryonic mass) | ||
|
|
|
|
| Massfunctions (individual codes) | |||
| Gadget-2 (SPH run, grid like IC) | TVD (Results are based on converting the grid to artificial SPH particles, ryu2snap.pro) | ENZO(Results are based on converting the grid to artificial SPH particles, enzo2snap.pro) | |
|
|

|
|
| Gadget-2 vs. TVD | Gadget-2 vs. ENZO | TVD vs. ENZO | |
|
|
|
|
| Baryon fraction | |||
| Gadget-2 | Gadget-2 (box like ICs) | TVD | ENZO |
|

|
|
|
| Gadget vs.TVD | Gadget vs.ENZO | TVD vs.ENZO | |
|
|
|
|
| Gadget-2 | |||
| rho Volume | rho Mass | T Volume | T Mass |
|
|
|
|
| Gadget-2 (box like ICs) | |||
| rho Volume | rho Mass | T Volume | T Mass |
|
|
|
|
| TVD | |||
| rho Volume | rho Mass (box like ICs) | T Volume | T Mass |
|
|
|
|
| ENZO | |||
| rho Volume | rho Mass (box like ICs) | T Volume | T Mass |
|
|
|
|
| Comparison | |||
| rho Volume | rho Mass (box like ICs) | T Volume | T Mass |
|
|
|
|
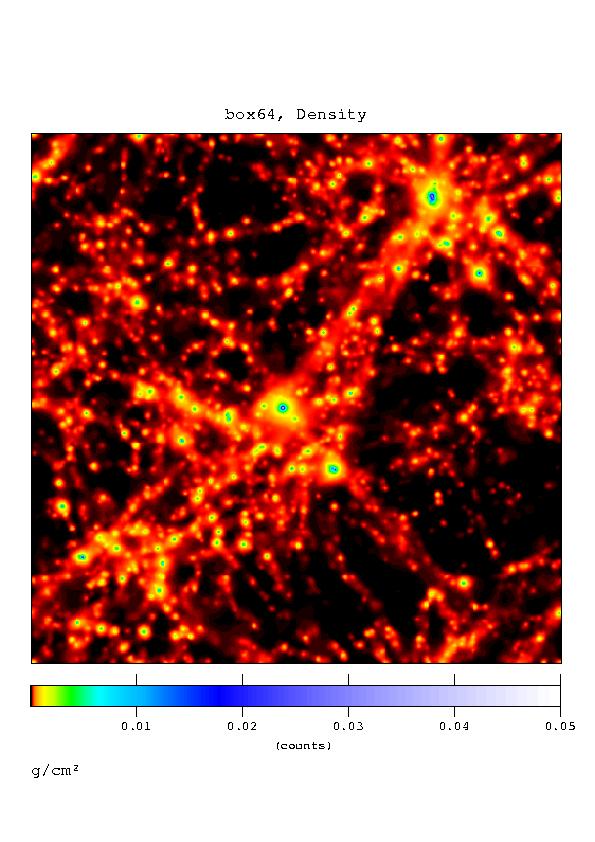
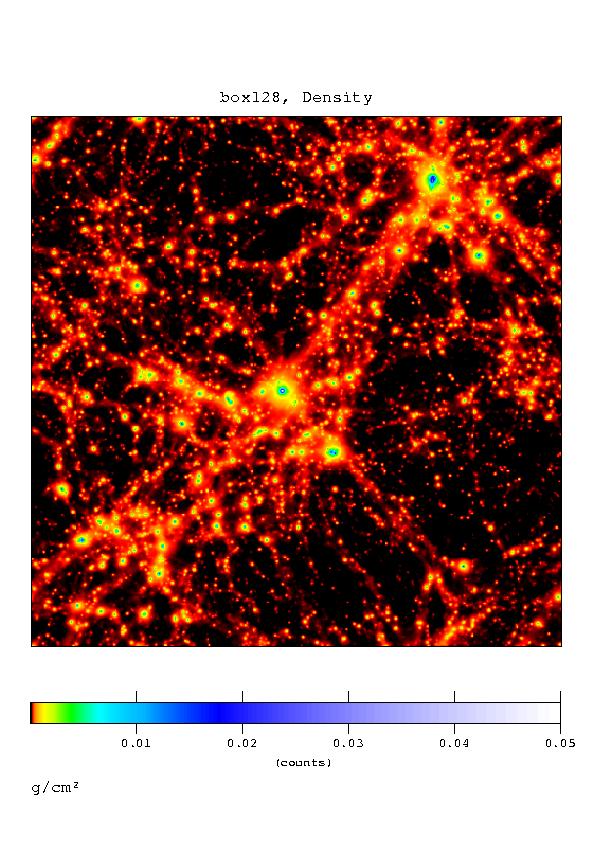
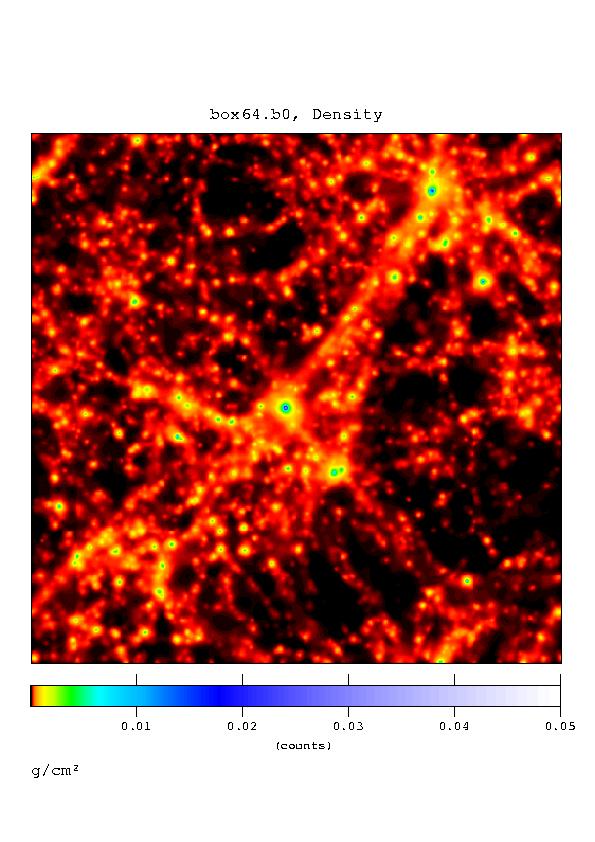
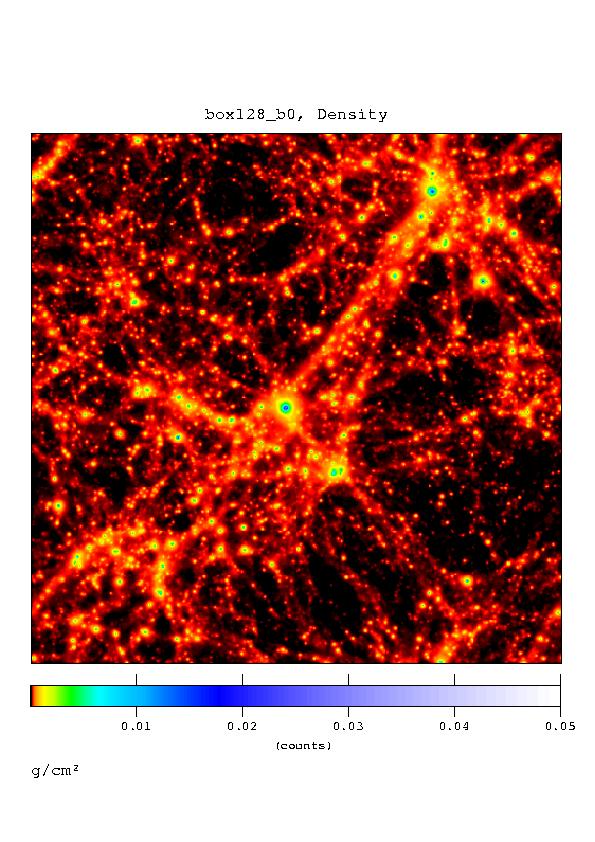
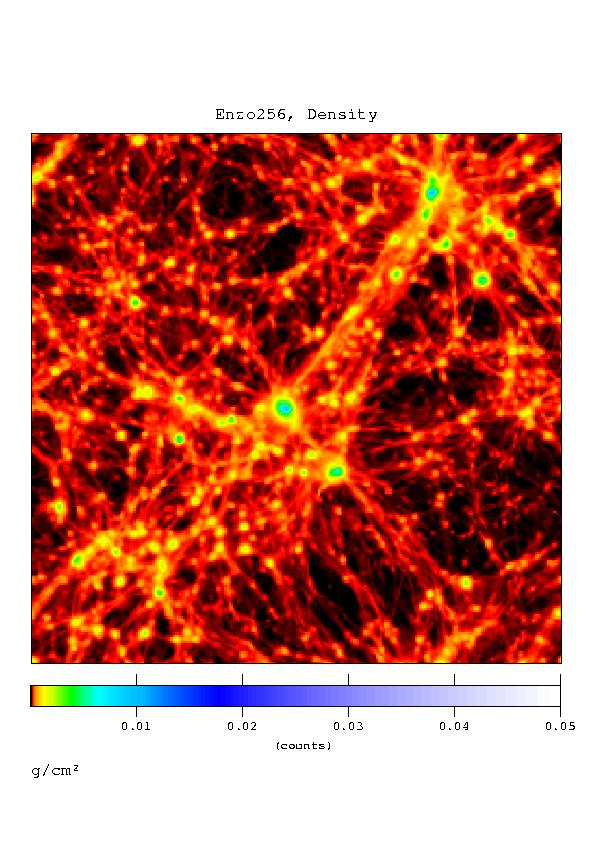
| Projected gas density | |||||
| gas | b0 | ||||
| 64ł | 128ł | 256ł | 64ł | 128ł | 256ł |
|
|

|
|
|

|
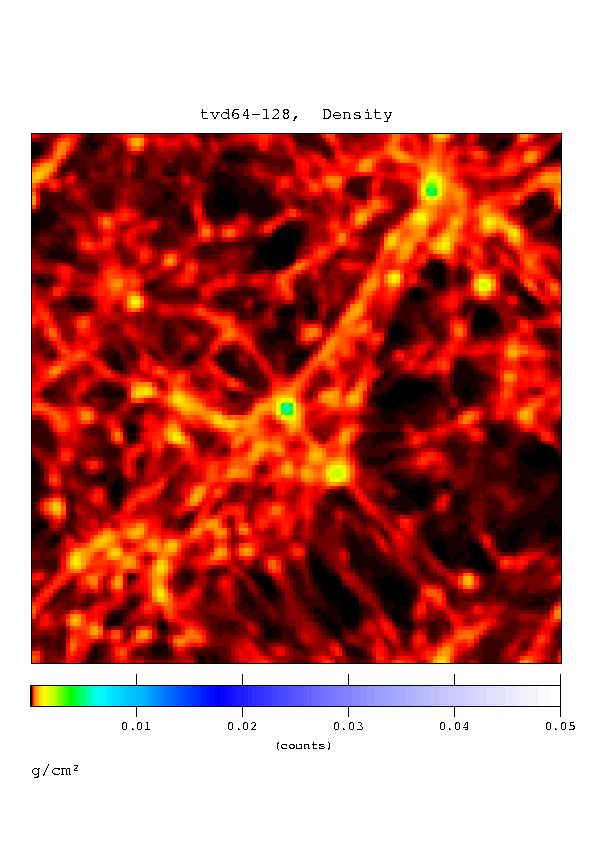
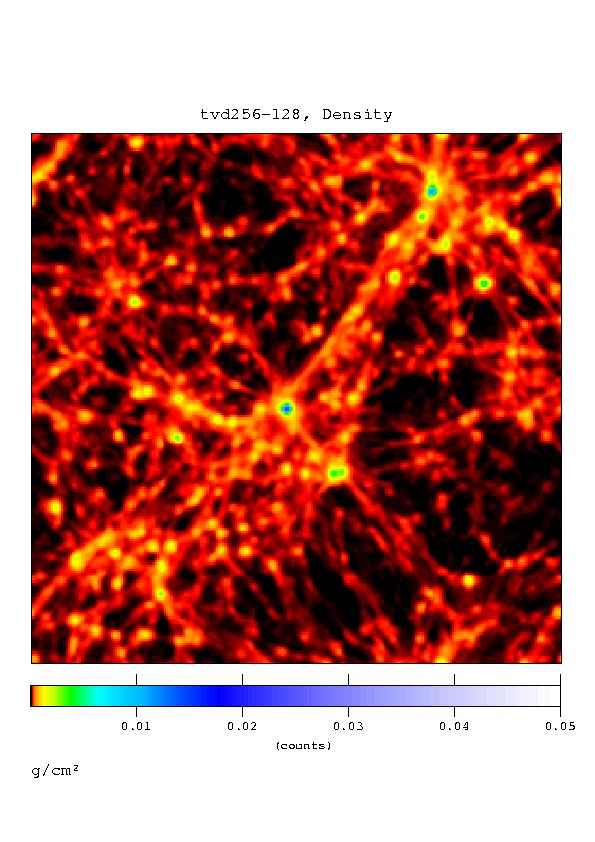
| TVD | ENZO | ||||
| (128-64)ł | (256-128)ł | (512-256)ł | 128ł | 256ł | 512ł |
|
|

|

|
|
|
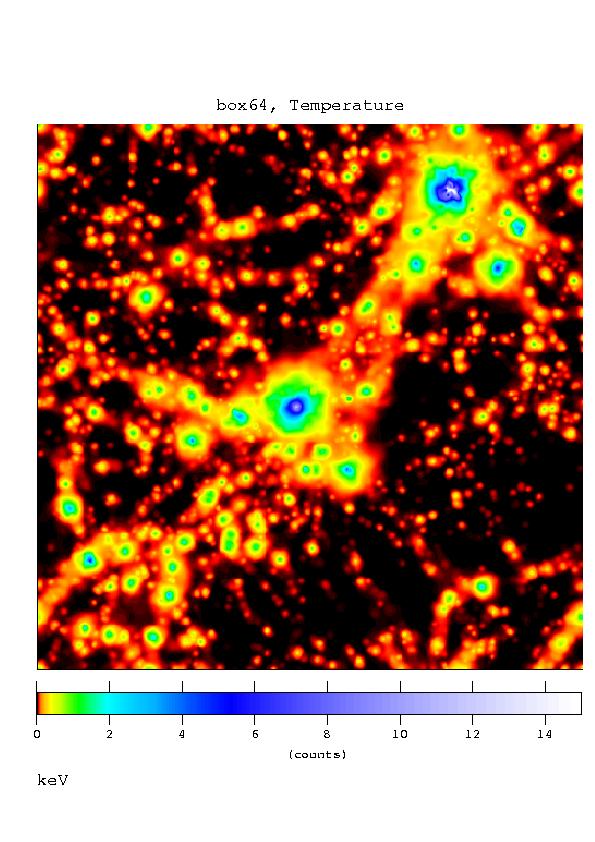
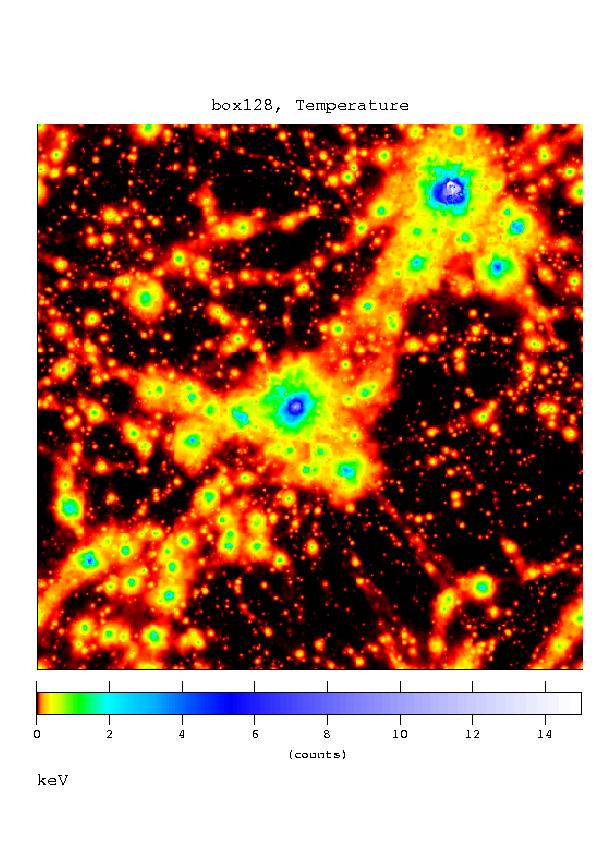
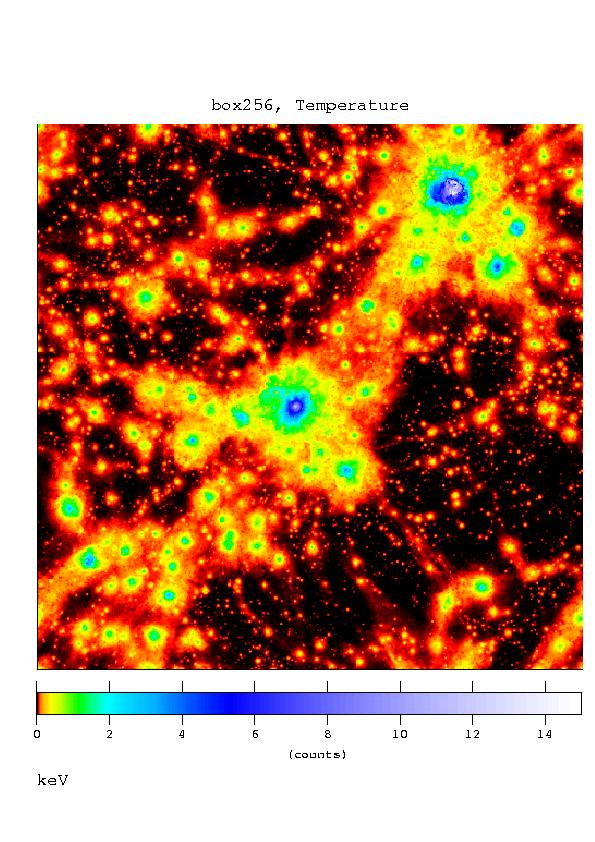
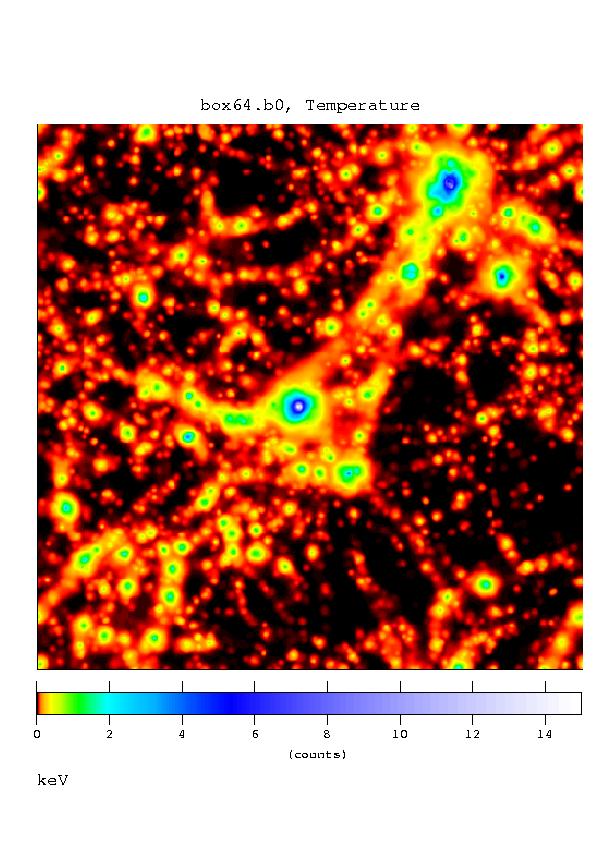
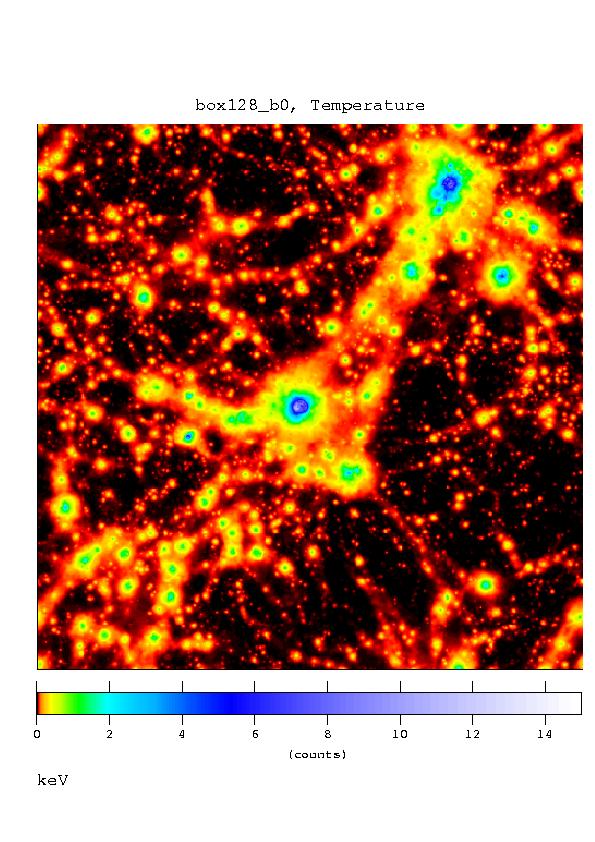
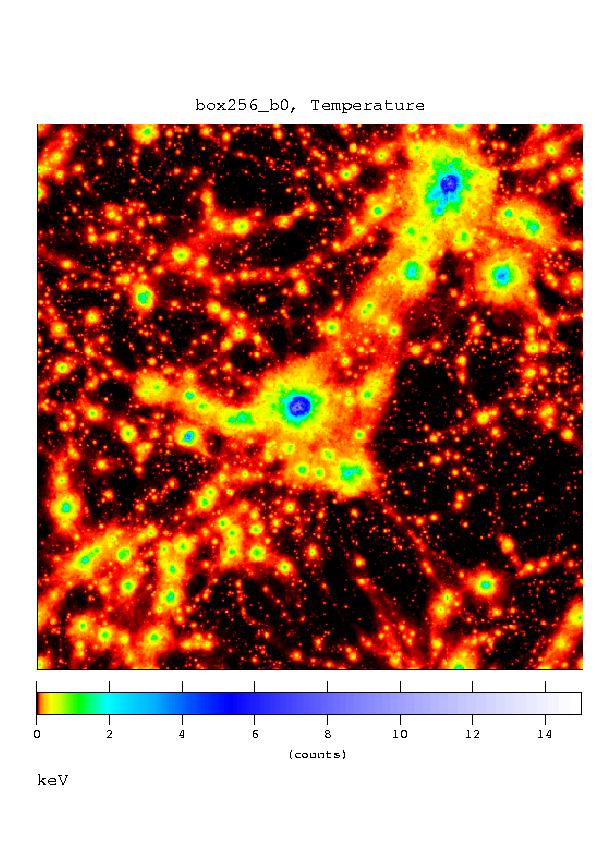
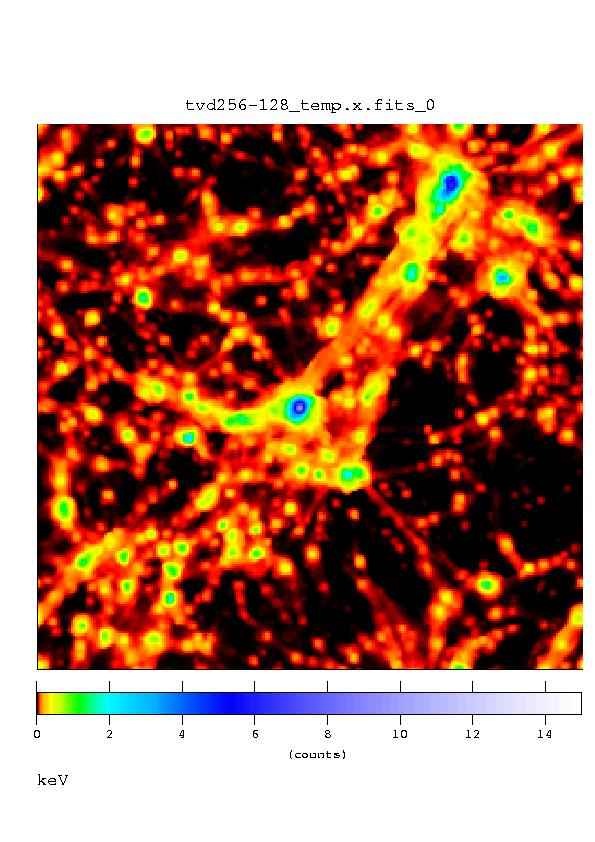
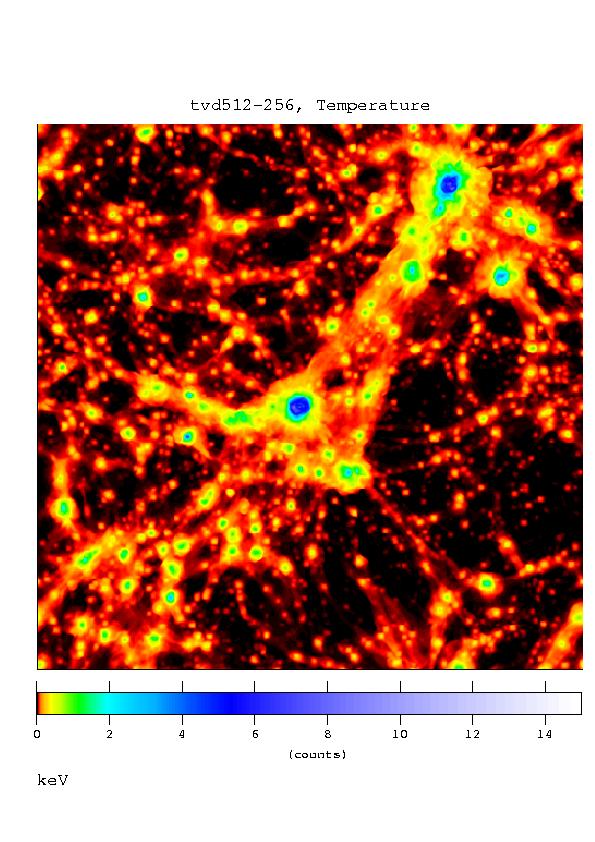
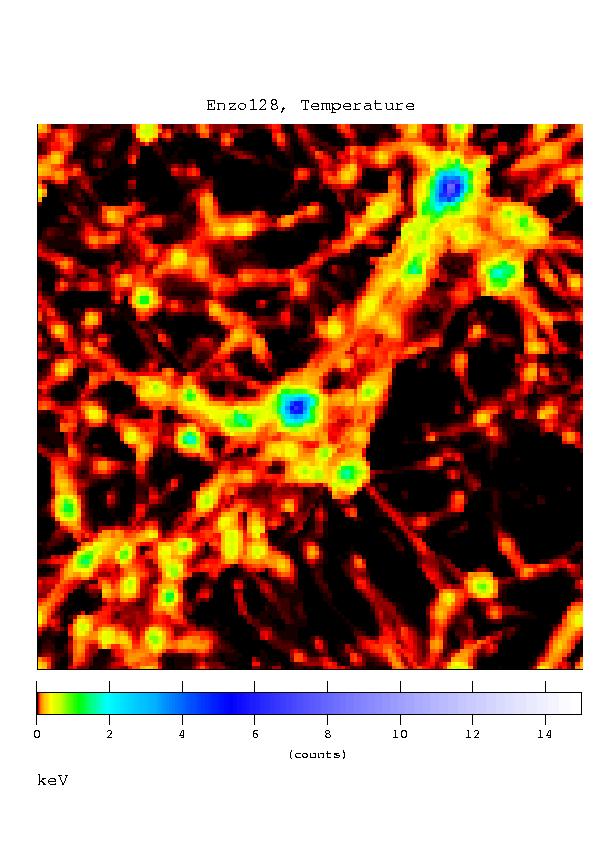
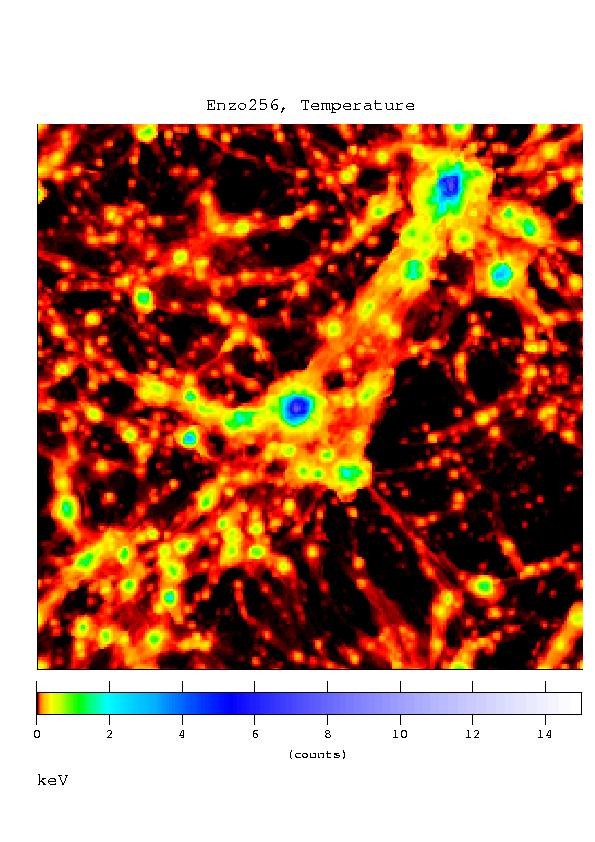
| Projected gas temperature (mass weighted) | |||||
| gas | b0 | ||||
| 64ł | 128ł | 256ł | 64ł | 128ł | 256ł |
|
|
|
|
|
|
| TVD | ENZO | ||||
| (128-64)ł | (256-128)ł | (512-256)ł | 128ł | 256ł | 512ł |

|
|
|
|
|
|
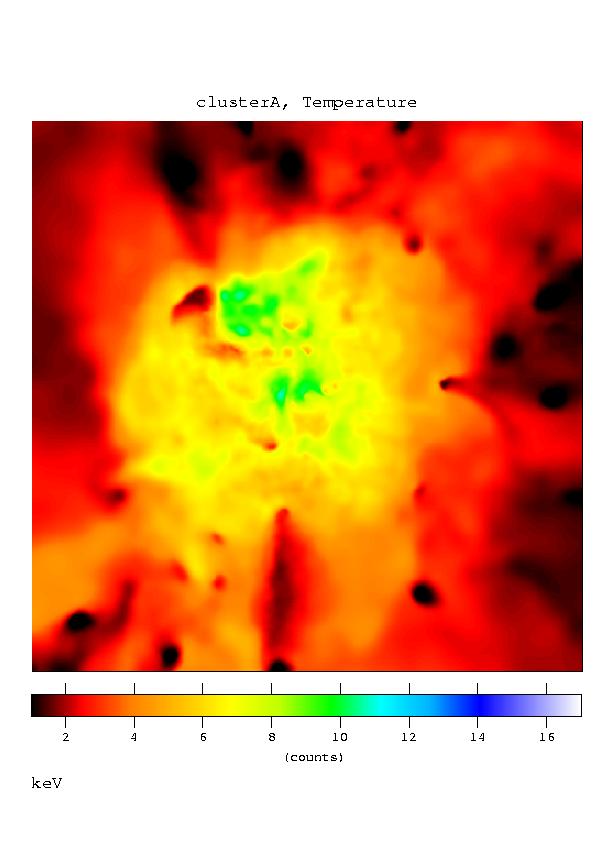
| Cluster A | ||||||
| Run | X [Mpc/h] | Y [Mpc/h] | Z [Mpc/h] | Mvir [Msol/h] | Rvir [kpc/h] | |
| dm | 64ł | 60.6652 | 75.5600 | 88.17896 | 2.611e15 | 2890.30 |
| 128ł | 60.6522 | 75.8406 | 87.8016 | 2.695e15 | 2921.52 | |
| 256ł | 60.5536 | 75.8819 | 87.7350 | 2.747e15 | 2940.53 | |
| gas | 64ł | 60.6398 | 75.6028 | 87.9461 | 2.587e15 | 2881.69 |
| 128ł | 60.6273 | 75.7304 | 87.7092 | 2.699e15 | 2922.69 | |
| b0 | 64ł | 61.6577 | 75.6777 | 88.9890 | 1.127e15 | 2290.93 |
| 128ł | 61.5856 | 75.6988 | 88.8988 | 1.3375e15 | 2312.70 | |
| 256ł | 61.4941 | 75.6521 | 88.8680 | 1.359e15 | 2325.42 | |
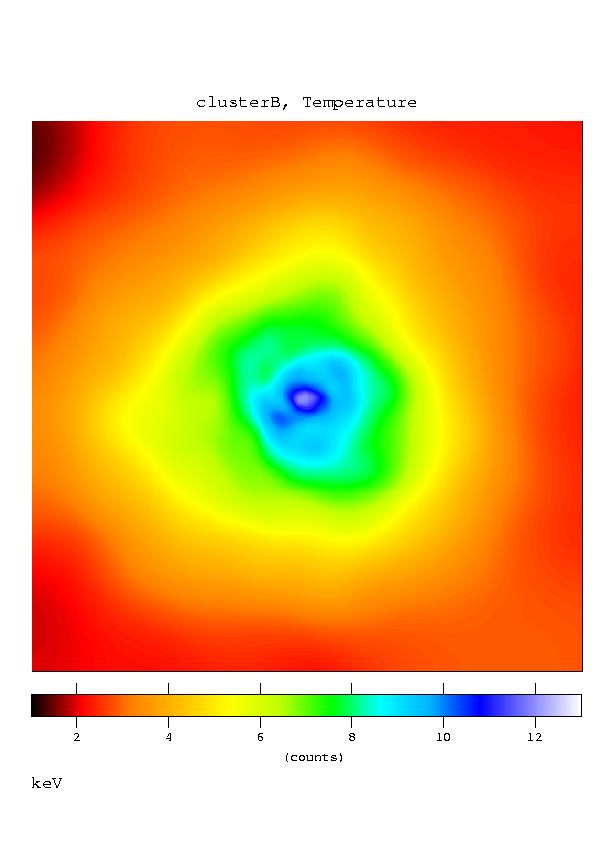
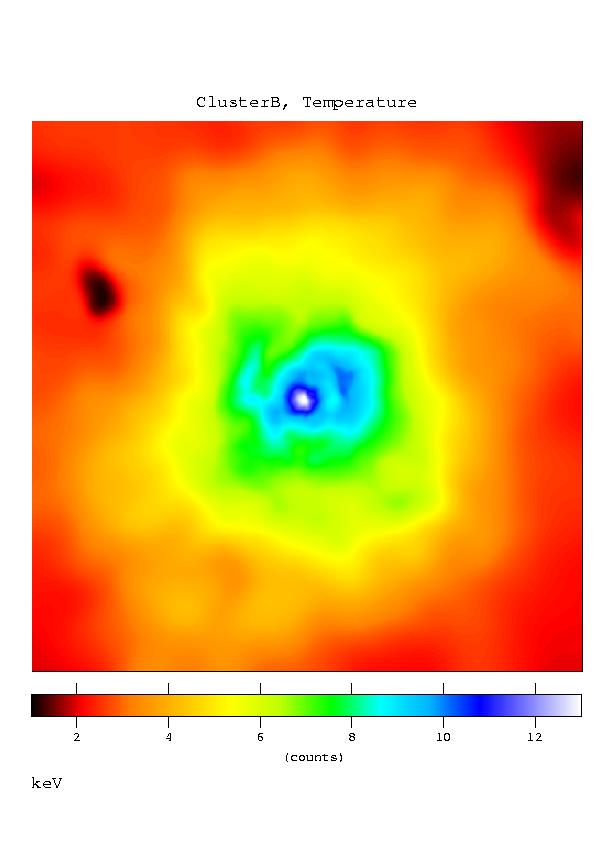
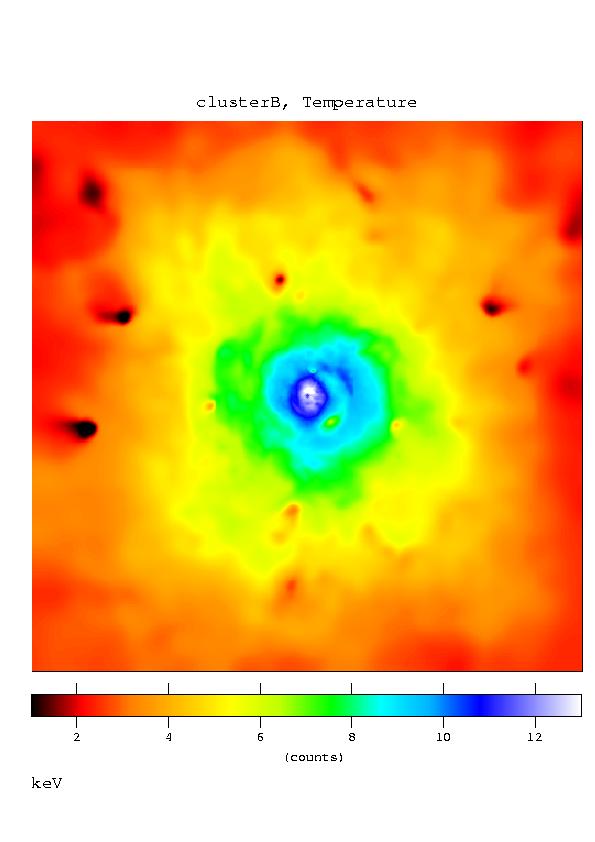
| Cluster B | ||||||
| Run | X [Mpc/h] | Y [Mpc/h] | Z [Mpc/h] | Mvir [Msol/h] | Rvir [kpc/h] | |
| dm | 64ł | 92.4939 | 47.1792 | 48.0768 | 1.687e15 | 2498.80 |
| 128ł | 92.6371 | 47.1574 | 48.0683 | 1.586e15 | 2448.27 | |
| 256ł | 92.6508 | 47.1263 | 48.0983 | 1.606e15 | 2458.80 | |
| gas | 64ł | 92.6904 | 47.2706 | 48.0845 | 1.631e15 | 2471.17 |
| 128ł | 92.5842 | 47.1623 | 48.0751 | 1.605e15 | 2457.75 | |
| b0 | 64ł | 92.7272 | 47.6547 | 47.9963 | 1.546e15 | 2427.32 |
| 128ł | 92.8785 | 47.7715 | 48.0926 | 1.623e15 | 2466.80 | |
| 256ł | 93.1952 | 47.8979 | 48.0630 | 1.639e15 | 2475.01 | |
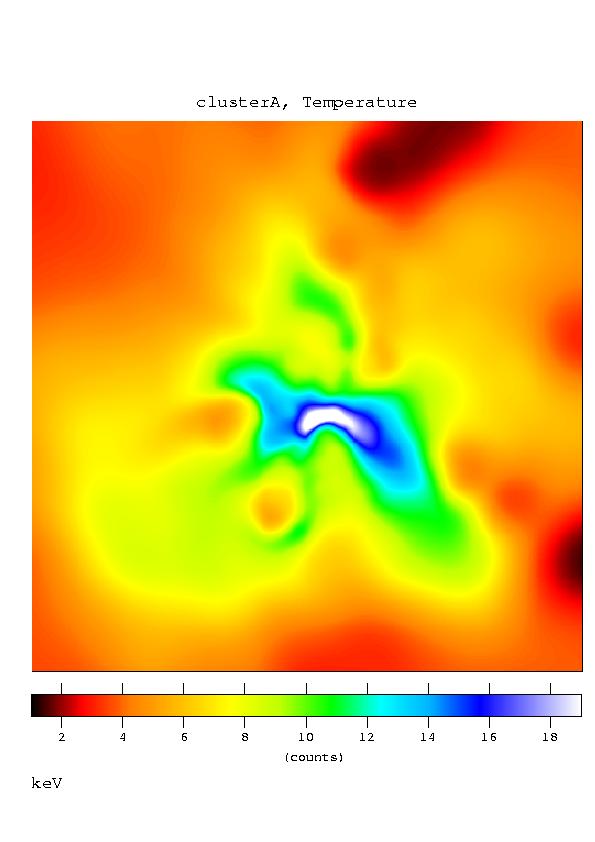
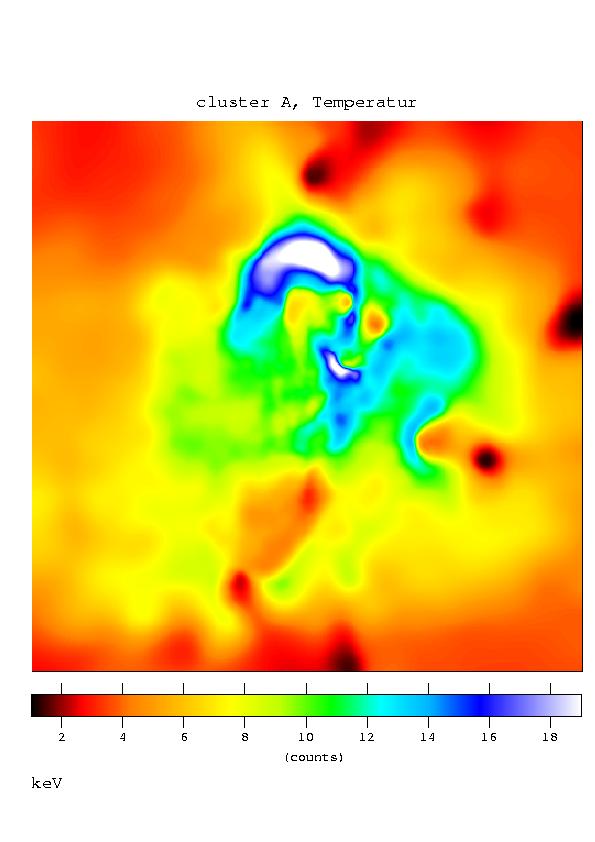
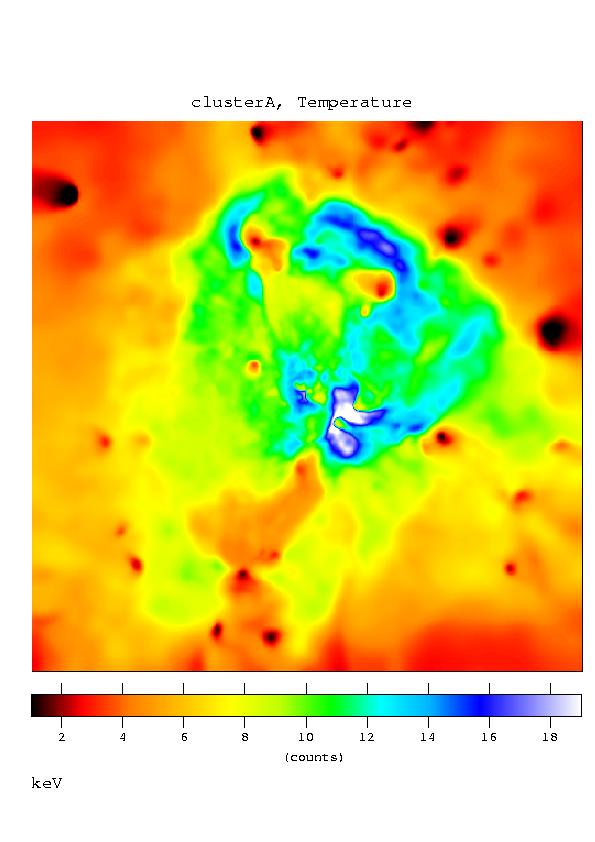
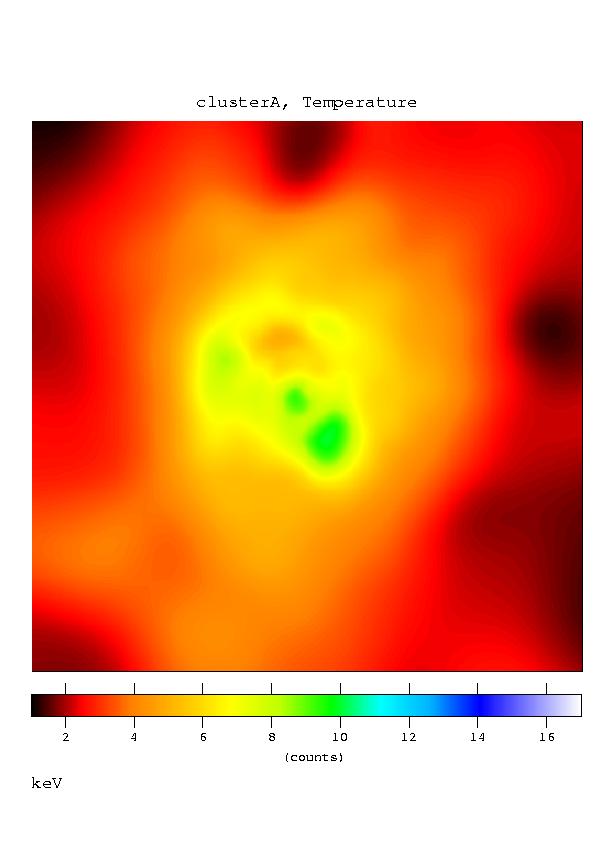
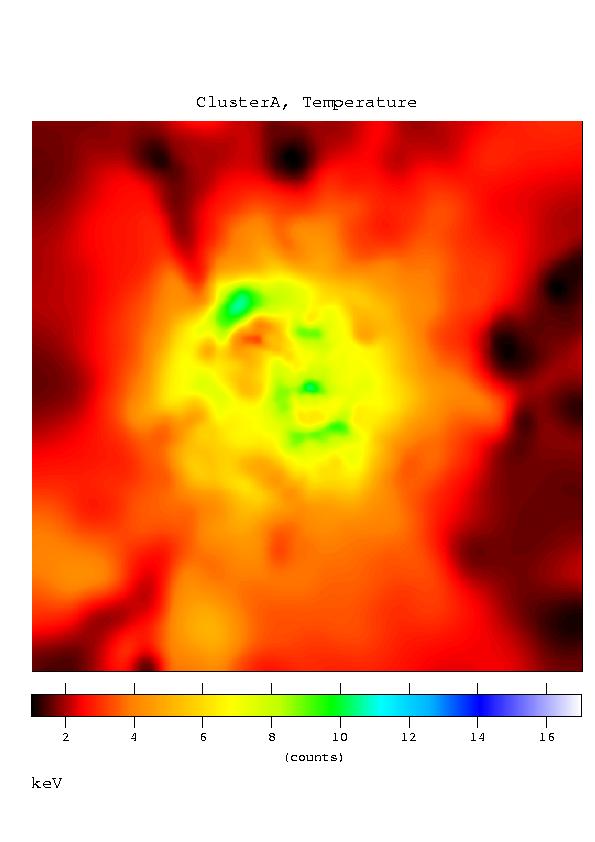
| Cluster A | |||||
| gas | b0 | ||||
| 64ł | 128ł | 256ł | 64ł | 128ł | 256ł |
|
|
|
|
|
|
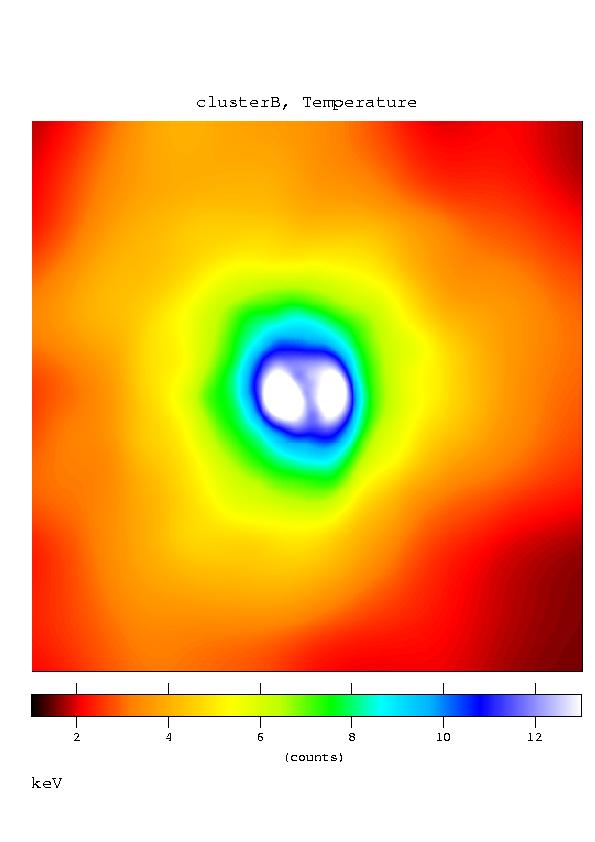
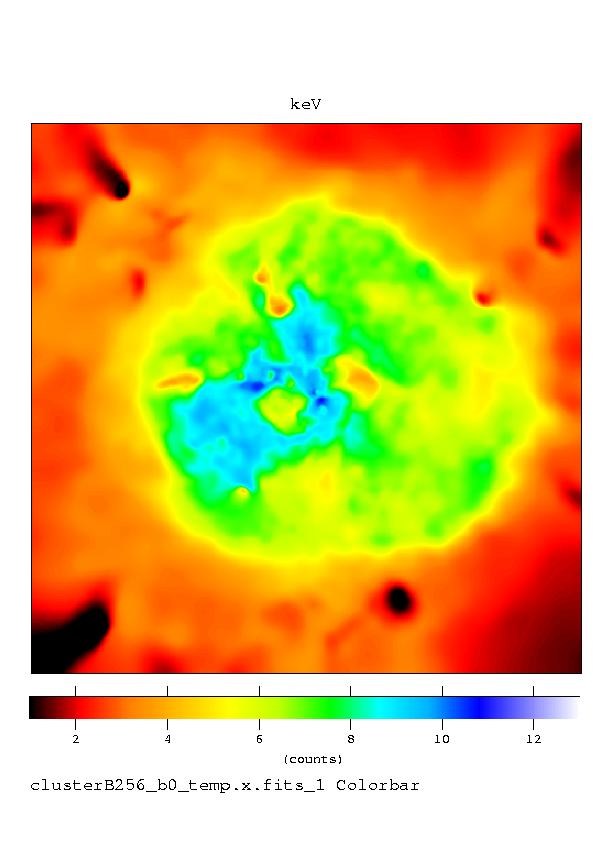
| Cluster B | |||||
| gas | b0 | ||||
| 64ł | 128ł | 256ł | 64ł | 128ł | 256ł |
|
|
|
|

|
|
| Gadget | |||||
| Cluster A | Cluster B | ||||
| density | temperature | entropy | density | temperature | entropy |
|
|

|
|
|
|
| TVD | |||||
| Cluster A | Cluster B | ||||
| density | temperature | entropy | density | temperature | entropy |
|
|
|
|
|

|
| ENZO | |||||
| Cluster A | Cluster B | ||||
| density | temperature | entropy | density | temperature | entropy |
|
|
|
|
|
|
| Gadget vs. TVD | |||||
| Cluster A | Cluster B | ||||
| density | temperature | entropy | density | temperature | entropy |
|

|
|
|
|
|
| Gadget vs. ENZO | |||||
| Cluster A | Cluster B | ||||
| density | temperature | entropy | density | temperature | entropy |
|
|
|

|
|
|
| TVD vs. ENZO | |||||
| Cluster A | Cluster B | ||||
| density | temperature | entropy | density | temperature | entropy |
|
|
|
|
|
|
| Cluster B | |||
| Volume fraction for different treshholds | Entropy profiele using different tresholds | Convergence test for low treshold | Comparison using low treshold |
|
|
|
|
| Differential machnumber distributions | |||
| Gadget-2 | Gadget-2 (box like ICs) | ||
|
|
|
|